


PQA-HiVIEW PRO(모델명: 9624-50)는 PW3197 및 PW3198 핸드형 전력품질분석기로 측정한 데이터(바이너리)를 PC로 분석 하기 위한 소프트웨어입니다. 버전 2.0 이상을 사용하면 됩니다.
모델 3197에서는 SD카드 또는 USB 연결, 그리고 모델 3198의 경우에는 PC 카드 또는 PC 전송으로 측정된 데이터를 바이너리 형태로 PC에 저장할 수 있습니다.
| 모델 | 설명 | Quote |
| 9624-50 | PQA 하이 뷰 프로 |  |
When analyzing measurement data (binary) on the PC with the PW3198, please use PQA-HiVIEW PRO 9624-50 version 2.0 or later. Save binary data from the PW3198 to the PC using the SD card or PC transfer, from the 3197 with a USB connection, or from the 3196 with a PC card or PC transfer.
| PQA-HiVIEW PRO 9624-50 | |
| Compatible devices | POWER QUALITY ANALYZER PW3198, 3197, 3196 |
| Supplied media | CD-R ×1 |
| Operating environment | Computer running under Windows XP/Vista (32-bit), or Windows 7 (32-bit/64bit) |
| Data loading | PW3198: Saved binary data
3197 : Saved binary data 3196 : Saved binary data |
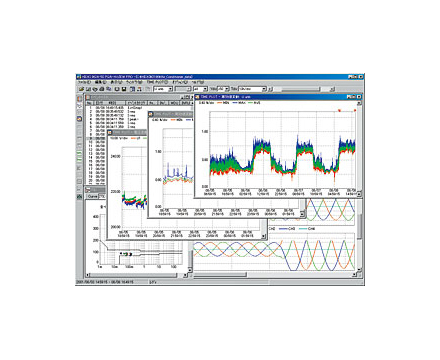
| Screen display | System, Time plot, Event list, Event data, Cursor function, Fluctuation graph of event voltage, Graph of event inrush currnet (at only PW3198, 3197), Integrated power, Demand |
| Copy function | Text data, Screen copy to clip-boad |
| Print function | Screen image, A4/ letter size, preview |
| CSV convert function | Time plot, Event waveform, Fluctuation of event voltage, Inrush current of event (at only PW3198, 3197), Flicker graph (at only PW3198, 3196), Demand, Integrated power |
| Report generation | Auto output: RMS voltage fluctuation graph, Worst case, Maximum/ minimum value list, Voltage total harmonic distortion percentage graph, All event waveforms, Detailed list of all events, other custom output, or detailed output |
| Only for the PW3198 and 3196 | [Screen display] Voltage, Transient waveform, Vector, DMM, Harmonic, Zero-, positive- and negative-phase calculations, Flicker graph, Cursor, High harmonic analysis orders (PW3198)
[Integrated power calculation] Analysis period: 1 - 35 days (PW3198)/ 31 days (3196), Graph, Consumption/ regeneration value, Cursor measurement, Maximum integrated power [Demand calculation] Demand period: 5 - 30 minutes, 1 - 12 hours, Analysis period: 1 - 35 days (PW3198)/ 31 days (3196), Demand graph of consumption value, Average demand, Peak demand, Load ratio [ITIC window] Event points are plotted on a tolerance curve (event duration versus swell, dip or interruption voltage percentage), Voltage percentage, Violation count display, Tolerance curve selection [EN50160 screen] Classification by overview, harmonic, signaling detail (3196) or measurement results [Data download] Via LAN [Saving settings] User-defined ITIC curves, Classification settings for measurement results, or other |
| 제목 | 다운받기 |
|---|---|
| 9624-50 데이터시트 | 다운로드 |